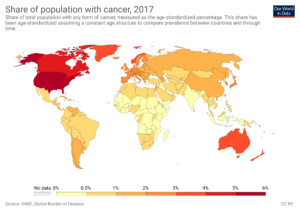
What’s the Correlation between Childhood Vaccine Doses and Cancer Rate?

Here is an updated comparison of the age-standardized cancer incidence rates (ASR per 100,000, both sexes, all cancers including non-melanoma skin cancer where applicable; 2022 GLOBOCAN data) with the total number of recommended childhood vaccine doses (routine schedule for healthy children from birth to ~18 years, counting all doses across all vaccines; excludes seasonal like annual flu/RSV unless universally routine, high-risk only, or catch-up).
Doses are based on national schedules as of early 2026 (post-US update). High-income countries often use combination vaccines (e.g., DTaP-IPV-Hib in one shot), so total injections are lower than doses, but the query focuses on doses (antigen exposures). Low-income countries follow WHO EPI basics (fewer additions like rotavirus, PCV, HPV, or varicella), leading to lower totals. No evidence links higher doses to cancer rates—patterns reflect development, screening, lifestyle, and diagnostics.
High Cancer Rate Countries (Top ~10)
These wealthy nations have comprehensive schedules with more additions (e.g., rotavirus 2–3 doses, varicella 2, HPV 1–2, boosters).
| Country | Cancer ASR (2022) | New Cases (2022) | Total Childhood Vaccine Doses (Routine, ~2026) | Key Notes on Schedule |
|---|---|---|---|---|
| Australia | 462.5 | 212,332 | ~40–45 | NIP: HepB (4), DTaP/Hib/IPV/HepB combos (multiple), PCV (3–4), Rota (2–3), MMRV (2), HPV (2), meningococcal boosters; high due to combos + additions. |
| New Zealand | 427.3 | 38,157 | ~35–40 | Similar to Australia; includes PCV, Rota, HPV (2). |
| Denmark | 374.7 | 48,840 | ~30 | Lower end: Core EPI + some; DTaP-IPV-Hib (multiple), PCV (3), MMR (2), HPV (2); minimal extras. |
| United States | 367.0 | 2,380,189 | ~30–35 (2026 update) | Reduced from pre-2026 ~84–88; now core: DTaP (5), IPV (4), Hib (3–4), PCV (4), HepB (3), MMR (2), VAR (2), HPV (1); others high-risk/shared. |
| Norway | 357.9 | 40,305 | ~30–35 | Similar to Denmark; core + HPV, PCV. |
| Canada | 345.9 | 292,098 | ~35–40 | Provincial variation; includes Rota, PCV, HPV (2), meningococcal. |
| Ireland | 344.7 | 31,242 | ~35–40 | Includes PCV, Rota, HPV, meningococcal. |
| Netherlands | 341.4 | 132,319 | ~30–35 | Core + PCV, HPV; efficient combos. |
| France | 339.0 | 483,568 | ~30–35 | DTaP-IPV-Hib combos, PCV, MMR, HPV. |
| Belgium | 324.7 | 81,132 | ~30–35 | Similar to neighbors; core + additions. |
Average for these: ~33–40 doses. Wealthier nations add 2–3 dose series (e.g., rotavirus, PCV) and boosters.
Low Cancer Rate Countries (Bottom ~10–15)
Mostly low/middle-income; schedules stick to WHO EPI core (~8–12 doses total, often fewer additions due to cost/prioritization). Under-reporting and shorter lifespans contribute to low ASRs.
| Country | Cancer ASR (2022) | New Cases (2022) | Total Childhood Vaccine Doses (Routine) | Key Notes on Schedule |
|---|---|---|---|---|
| Sierra Leone | 35.9 | 1,918 | ~10–12 | EPI core: BCG (1), DTP (3), Polio (3–4), Measles (1–2); limited additions. |
| Gambia | 79.2 | 1,196 | ~10–14 | EPI + some PCV/Rota in recent years. |
| Congo (Rep.) | 80.7 | 2,727 | ~10–12 | Basic EPI. |
| Nepal | 81.6 | ~30,000 (est.) | ~12–15 | EPI + Hib, PCV, Rota in some. |
| Yemen | 83.1 | ~25,000 (est.) | ~10–12 | Core EPI; disruptions from conflict. |
| Niger | 83.7 | ~15,000 (est.) | ~10–12 | Basic EPI. |
| Timor-Leste | 84.5 | 828 | ~10–12 | EPI core. |
| Sudan | 95.6 | ~35,000 (est.) | ~10–12 | EPI; variable access. |
| India | 98.5 | 1,413,316 | ~12–18 | EPI + PCV (3), Rota (2–3), JE in endemic areas; boosters. |
| China | 201.6 | 4,824,703 | ~15–20 | EPI + more (HepA, Varicella optional/routine in places). |
Average for these: ~10–15 doses. Focus on essentials; fewer multi-dose additions (e.g., no universal varicella, limited HPV).
Key Observations
- High-cancer countries average higher doses (~33–40) than low-cancer ones (~10–15), but the gap narrowed post-2026 US changes (from outlier ~84+ to aligned ~30–35).
- Difference driven by income/development: Wealthier add vaccines preventing non-fatal diseases (e.g., rotavirus diarrhea, varicella) and have boosters. Poorer focus on high-mortality ones (e.g., measles, polio).
- Cancer rates correlate with wealth/aging/screening, not vaccine doses. Vaccines like HepB/HPV prevent cancers (liver/cervical).
- Data sources: GLOBOCAN/WCRF (cancer); WHO Immunization Data Portal, national schedules, HHS/CDC 2026 updates, ECDC (vaccines). Schedules vary slightly by exact product/timing; totals approximate (e.g., combos count as separate antigen doses).