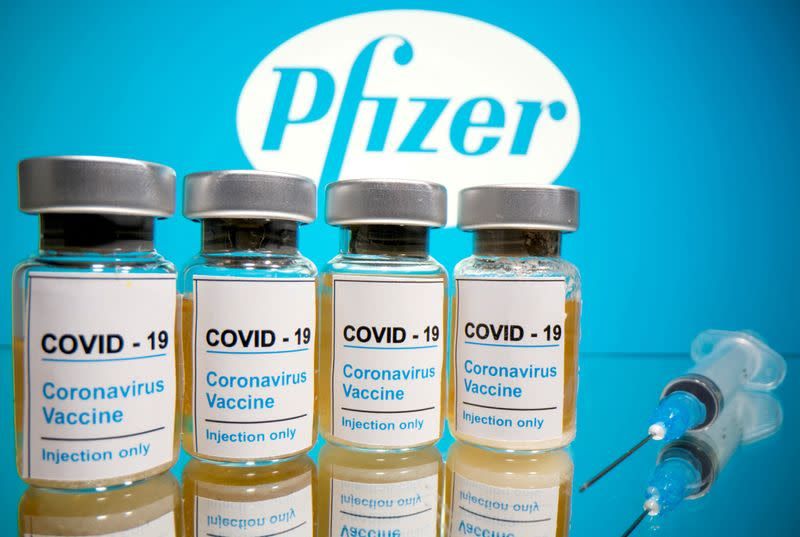
Counties With Highest COVID Jab Rates See More COVID Cases Than Less Jabbed Counties

According to reports, a confounding datapoint has surfaced regarding U.S. counties that saw the highest rates of received COVID shots versus those counties bearing the lowest rates of received shots – in that the rates of COVID-19 infections were higher in the counties with a higher percentage of received COVID jabs.
Per the CDC’s data regarding inoculation rates in tandem with reported positive cases of COVID by county, cases of COVID between March 28th and April 4th were reportedly higher in counties that bore higher percentages of doled out COVID jabs.
This follows data from around the world showing that COVID vaccines do not prevent serious illness or death.
The Epoch Times reported that the “500 counties where 62-95 percent of the population has been vaccinated detected more than 75 cases per 100,000 residents on average,” whereas the “500 counties where 11-40 percent of the population has been vaccinated detected about 58 cases per 100,000 residents on average.”
In the analysis conducted by The Epoch Times, they cited that the CDC’s data “is skewed” to a degree due to them suppressing “figures for counties with very low numbers of detected cases (1-9) for privacy purposes,” and thus worked off of a assumptive average of five cases per 100,000 within these counties.
Another factor outlined in the cases number was the fact that counties with the lowest number of doled out COVID shot were “averaging less than 20,000 in population,” whereas counties with higher jab rates “had an average population of over 330,000.”
However, the idea that more heavily populated areas are more likely have higher infection rates simply due to their population size wasn’t the case per the conducted analysis – as The Epoch Times reported, “Even when comparing counties of similar size, the most vaccinated ones tended to have higher case rates than those least vaccinated.”
When comparing counties with a population of one million or more residents, the 10 counties bearing the most COVID jabs were shown to have a COVID case rate 27% greater than the 10 counties with the lowest rates of received COVID shots.
Moving on to counties with populations of 500,000 – one million, the COVID cases rates were nearly 19% higher in counties with the higher rates of shots. As for counties with populations of 200,000 – 500,000, the difference in positive COVID cases was nearly 55% higher in the counties harboring the higher rates of COVID shots. And when it came to comparing counties with populations of 100,000 – 200,000, there over a 200% disparity in counties with higher rates of the jab.
It should be noted that digesting reported cases of COVID throughout the country doesn’t necessarily mean that the reported cases are a reflection of reality, as COVID testing protocols from county to county are hardly uniform – meaning that counties showcasing low numbers on paper could simply be due to residents not getting tested as often.


