COVID Infection Higher In Vaccinated Individuals: Analysis
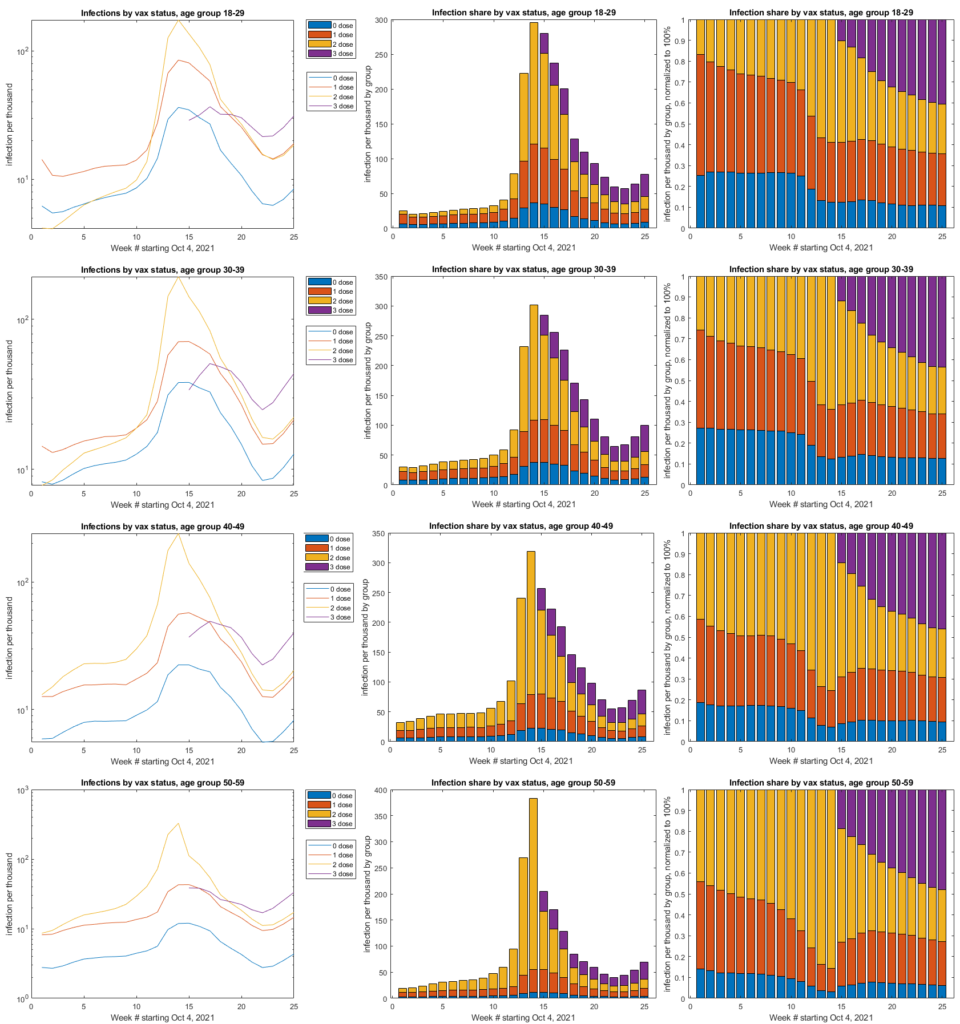
Analysis of infection rates in UK by vaccination status by SnowApe:
Methodology:
For each reporting period, I calculated the number of people in each vaccination category and in each age group by the following:
Assign the total population minus the reported number of first doses to the zero dose category
The reported number of first doses minus the number of second to the one dose category
The reported number of second doses minus the number of third doses to the two dose category
The reported number of third doses to the three dose category
I then calculated the infections per thousand for each category and age by dividing the reported infections per category by the size of each category, multiplied by 1000 to return infections per thousand
The first graph represents infections per thousand per group over time, plotted on a semi-log
The second graph shows the infected per thousand on a stacked graph.
The third graph shows the stacked bar graph, but normalized to 100% by dividing the infected per thousand per group by the total infected for the reporting period in each age bracket.
Analysis weaknesses:
- The infection reports appear to be lagged 2 weeks, whereas innoculations records are reported to-date.
- The age breakdown was taken from “mid-2020” data, and the population has not been aged through this analysis.
Similar data are being published by Walgreen’s in the US:
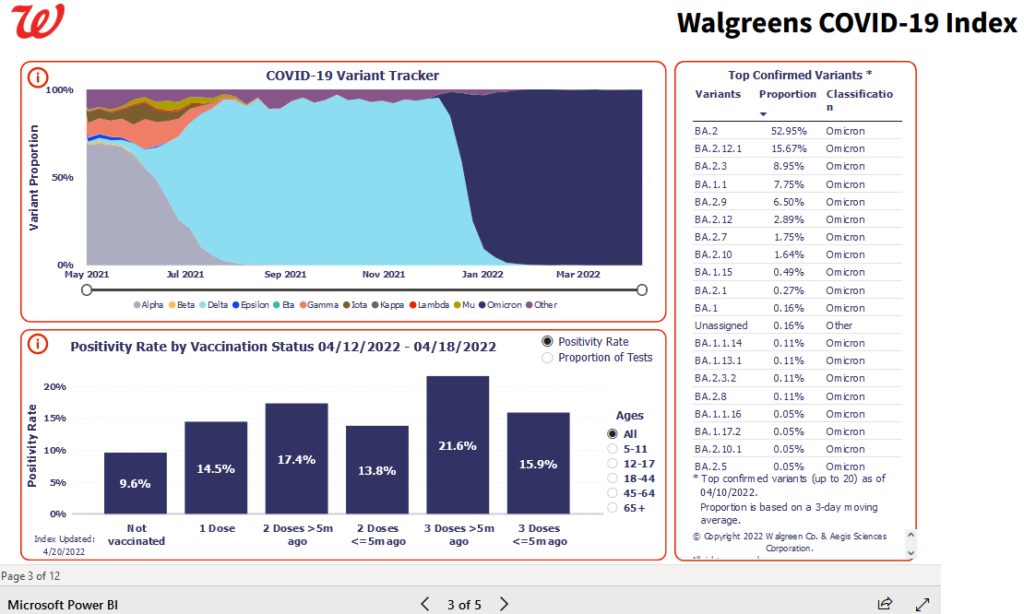
At the time of the screen capture, the unvaccinated were the least likely group to be COVID-positive with the 3-dose crowd being the highest for all age groups (Source: Walgreens.com).
FAQS:
Q(part1): Did you account for the proportion of vaxxed being higher than unvaxxed and increasing over time?
A(part1): Yes. The data presented here shows infections per thousand of each group. If there were 10 unvax people, 5 of which tested positive, the rate would be the same for 500 vaxed testing positive of a population of 1000.
Q(part2): and how those who aren’t vaxxed are typically younger and won’t get tested as much because they don’t get symptoms?
A(part2): It may not be possible to adjust for those who opt not to test
Q: Did the raw data offer negative tests per thousand as well?
A: No. I could not find any raw data for negative tests
Sources
Population by age:
Vax surveilance reports (infected by categoty):
https://www.gov.uk/government/publications/covid-19-vaccine-weekly-surveillance-reports
UK vaccination statistics: